

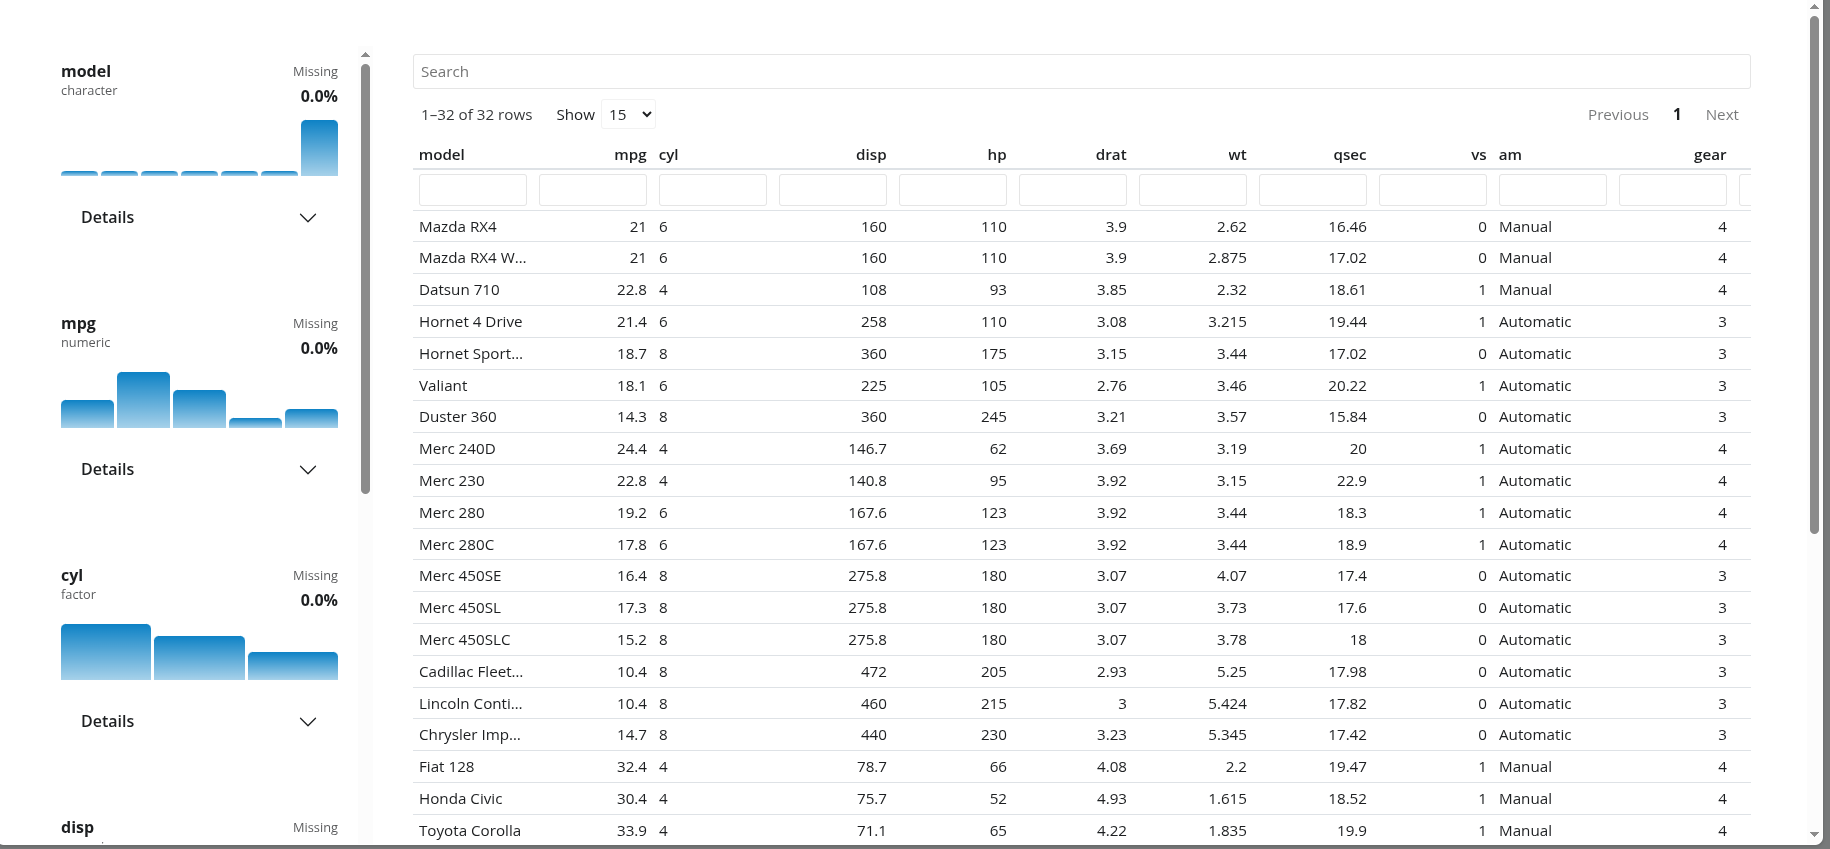
shinydataviewer provides a reusable Shiny module for
viewing tabular data with a searchable table and a variable summary
sidebar inspired by the Positron data viewer.
Install shinydataviewer from CRAN:
install.packages("shinydataviewer")You can install the development version from GitHub:
pak::pak("Ryan-W-Harrison/shinydataviewer")shinydataviewer is designed to be used as a reusable
Shiny module. The main exported functions are:
data_viewer_ui(id)data_viewer_server(id, data)data_viewer_card_ui(id, title = NULL)summarize_columns(df)Both UI helpers accept plot_color to customize all
variable-summary mini plots in a viewer with any CSS color, such as
"var(--bs-success)".
data should be a reactive expression that returns a
data.frame. Supported column classes are numeric, integer,
character, factor, logical, Date,
POSIXct/POSIXt, and
hms/difftime.
Use the module directly when you want the viewer layout to manage its own main table region:
library(shiny)
library(bslib)
library(shinydataviewer)

ui <- page_fillable(
  theme = bs_theme(version = 5),
  data_viewer_ui("viewer")
)

server <- function(input, output, session) {
  data_viewer_server(
    "viewer",
    data = reactive(iris)
  )
}

shinyApp(ui, server)Use data_viewer_card_ui() when the viewer needs to live
inside a larger dashboard or reporting layout:
library(shiny)
library(bslib)
library(shinydataviewer)

ui <- page_fillable(
  theme = bs_theme(version = 5),
  layout_columns(
    col_widths = c(4, 8),
    card(
      card_header("Context"),
      card_body("Supporting content goes here.")
    ),
    card(
      card_header("Dataset"),
      card_body(
        fill = TRUE,
        data_viewer_card_ui("viewer", title = NULL, full_screen = FALSE)
      )
    )
  )
)

server <- function(input, output, session) {
  data_viewer_server(
    "viewer",
    data = reactive(mtcars)
  )
}

shinyApp(ui, server)
An additional runnable example is included at
inst/examples/embedded-card-example.R.
The app in inst/examples/upload-dataset/ lets users
upload a CSV or RDS file and displays the resulting data frame in a
shinydataviewer card. Run it from a package checkout
with:
shiny::runApp("inst/examples/upload-dataset")For an installed copy of the package, use:
shiny::runApp(
  system.file("examples/upload-dataset", package = "shinydataviewer")
)The viewer styles are attached as a package dependency and use
Bootstrap 5 theme variables instead of fixed colors. In practice, that
means the module will follow the active bslib theme and
should pick up branding supplied through bs_theme() or a
brand.yml-driven theme without additional module-specific
configuration.
The viewer also follows live Bootstrap color-mode changes made with
bslib::input_dark_mode() or
bslib::toggle_dark_mode(), including its
reactable table and variable-summary sidebar.
ui <- page_fillable(
  theme = bs_theme(
    version = 5,
    brand = "brand.yml"
  ),
  data_viewer_card_ui("viewer")
)If you want access to the same summary data used by the module’s
variable panel, you can call summarize_columns()
directly:
summarize_columns(iris)The returned data frame has one row per input column. Its
summary_stats and distribution_data
list-columns contain the same precomputed payloads used by the sidebar
cards, including compact statistics, histogram bins, and top-level
categorical counts.