Missing values often occur in financial data due to a variety of reasons (errors in the collection process or in the processing stage, lack of asset liquidity, lack of reporting of funds, etc.). However, most data analysis methods expect complete data and cannot be employed with missing values. One convenient way to deal with this issue without having to redesign the data analysis method is to impute the missing values. This package provides an efficient way to impute the missing values based on modeling the time series with a random walk or an autoregressive (AR) model, convenient to model log-prices and log-volumes in financial data. In the current version, the imputation is univariate-based (so no asset correlation is used). In addition, outliers can be detected and removed.
The package is based on the papers:
J. Liu, S. Kumar, and D. P. Palomar (2019). Parameter Estimation of Heavy-Tailed AR Model With Missing Data Via Stochastic EM. IEEE Trans. on Signal Processing, vol. 67, no. 8, pp. 2159-2172. https://doi.org/10.1109/TSP.2019.2899816
R. Zhou, J. Liu, S. Kumar, and D. P. Palomar (2020). Student’s t VAR Modeling with Missing Data via Stochastic EM and Gibbs Sampling. IEEE Trans. on Signal Processing, vol. 68, pp. 6198-6211 https://doi.org/10.1109/TSP.2020.3033378
The package can be installed from CRAN or GitHub:
# install stable version from CRAN
install.packages("imputeFin")

# install development version from GitHub
devtools::install_github("dppalomar/imputeFin")
To get help:
library(imputeFin)
help(package = "imputeFin")
?impute_AR1_Gaussian
vignette("ImputeFinancialTimeSeries", package = "imputeFin")
RShowDoc("ImputeFinancialTimeSeries", package = "imputeFin")
To cite package imputeFin or the base reference in
publications:
citation("imputeFin")Let’s load some time series data with missing values for illustration purposes:
library(imputeFin)
data(ts_AR1_t)
names(ts_AR1_t)
#> [1] "y_missing" "phi0"      "phi1"      "sigma2"    "nu"
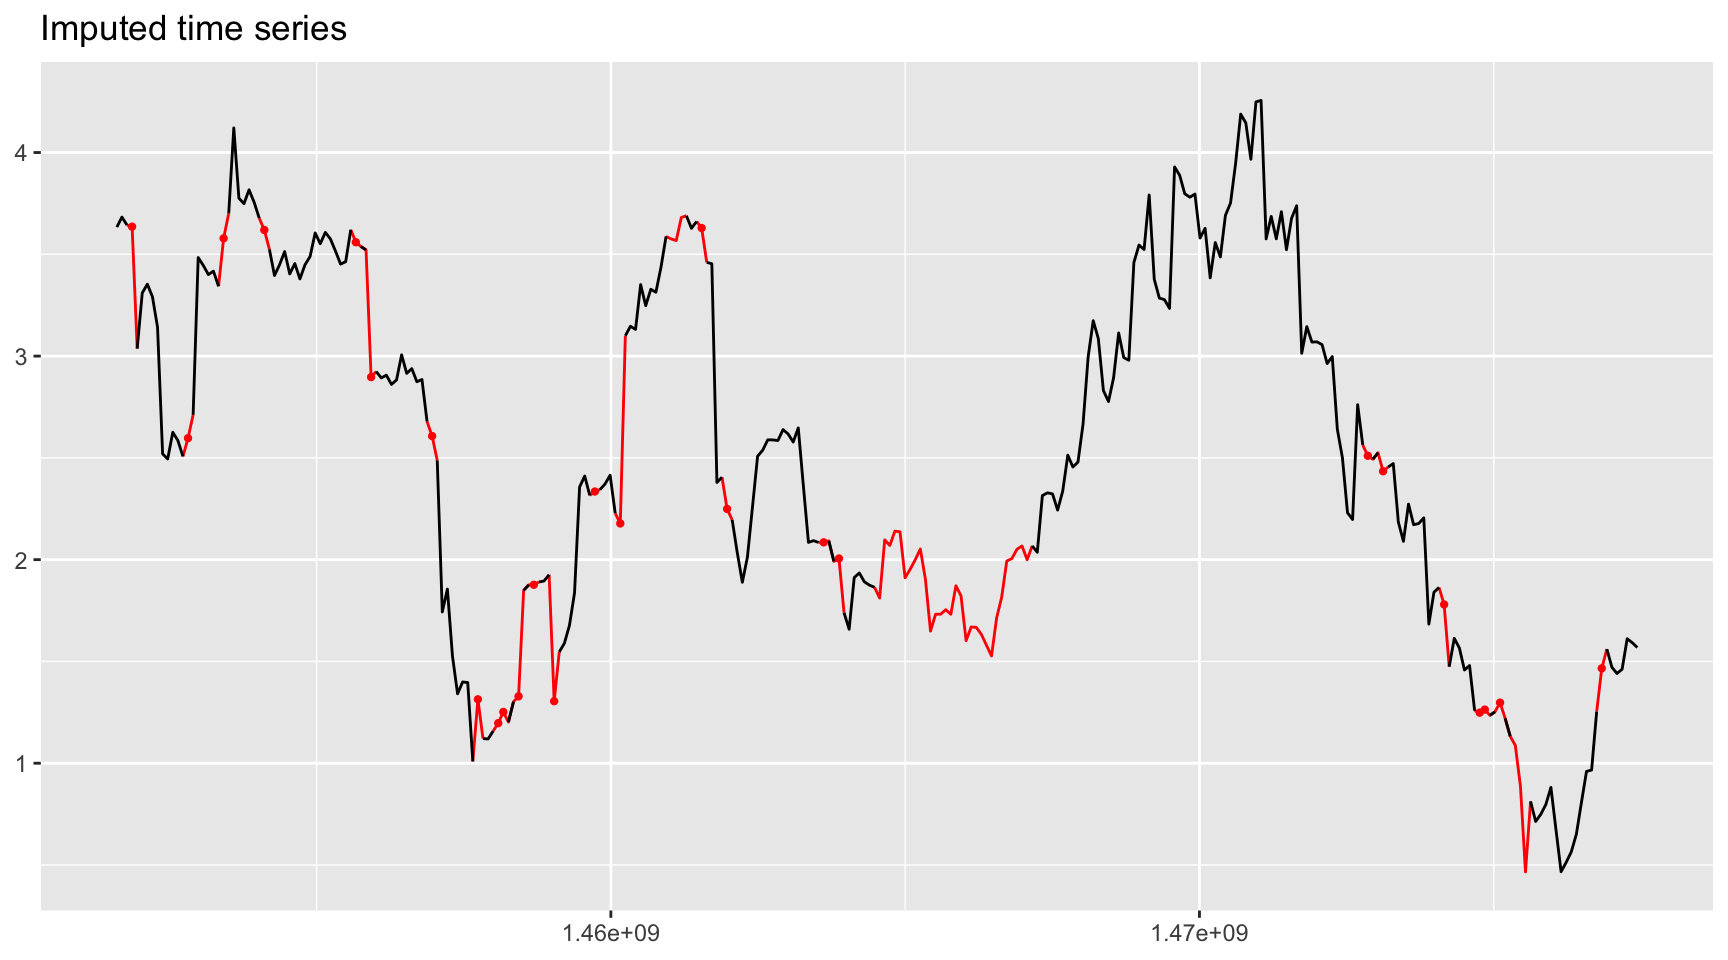
We can then impute one of the time series and plot it:
y_missing      <- ts_AR1_t$y_missing[, 3, drop = FALSE]
y_missing[100] <- 2*y_missing[100]  # create an outlier
plot_imputed(y_missing, title = "Original time series with missing values and one outlier")
y_imputed <- impute_AR1_t(y_missing, remove_outliers = TRUE)
#> var c: 60 missing values imputed and 1 outliers detected and corrected.
plot_imputed(y_imputed)
For more detailed information, please check the vignette.
README file: GitHub-readme.
Vignette: CRAN-vignette.