dppca provides tools for differentially private
principal component analysis (PCA) visualization in R. It
supports private PC direction estimation, private scree/PVE plots,
private score plots, grouped score visualizations, and an interactive
‘shiny’ app.
You can install the development version from GitHub with:
# install.packages("devtools")
devtools::install_github("yejinjo0220/dppca")The main workflow is:
dp_pc_dir().dp_scree() and dp_scree_plot().dp_score() and dp_score_plot().The examples below use the synthetic Gaussian cluster dataset included in the package.
library(dppca)

data(gau, package = "dppca")
X <- gaudp_pc_dir() estimates leading principal component
directions under differential privacy.
set.seed(123)

V <- dp_pc_dir(
  X,
  k = 5,
  g_dppca = TRUE,
  eps = 3,
  delta = 1e-4
)

V
The returned object contains private principal component directions that can be used PCA summaries and visualizations.
dp_scree() estimates private scree values or proportions
of variance explained. The method is chosen by the method
argument.
set.seed(123)

scree_clipped <- dp_scree(
  X,
  k = 5,
  method = "clipped",
  control = clipped_control(C_clip = 3),
  eps = 3,
  delta = 1e-4
)

scree_clipped
The package currently supports three scree estimation methods:
"clipped": clipped mean based estimator;"pmwm": private modified winsorized mean based
estimator;"huber": Huber-type robust estimator.Method-specific tuning parameters are specified using the control
helper unctions clipped_control(),
pmwm_control(), and huber_control().
For example, multiple scree methods can be requested by passing a
vector to method and a named list to
control.
set.seed(123)

scree_all <- dp_scree(
  X,
  k = 5,
  method = c("clipped", "pmwm", "huber"),
  control = list(
    clipped = clipped_control(C_clip = 3),
    pmwm = pmwm_control(a = 0, b = 50, trim_const = 10, eta = 0.01),
    huber = huber_control(k_min_m2 = -10, k_max_m2 = 10, m2_frac = 1 / 4)
  ),
  eps = 3,
  delta = 1e-4
)
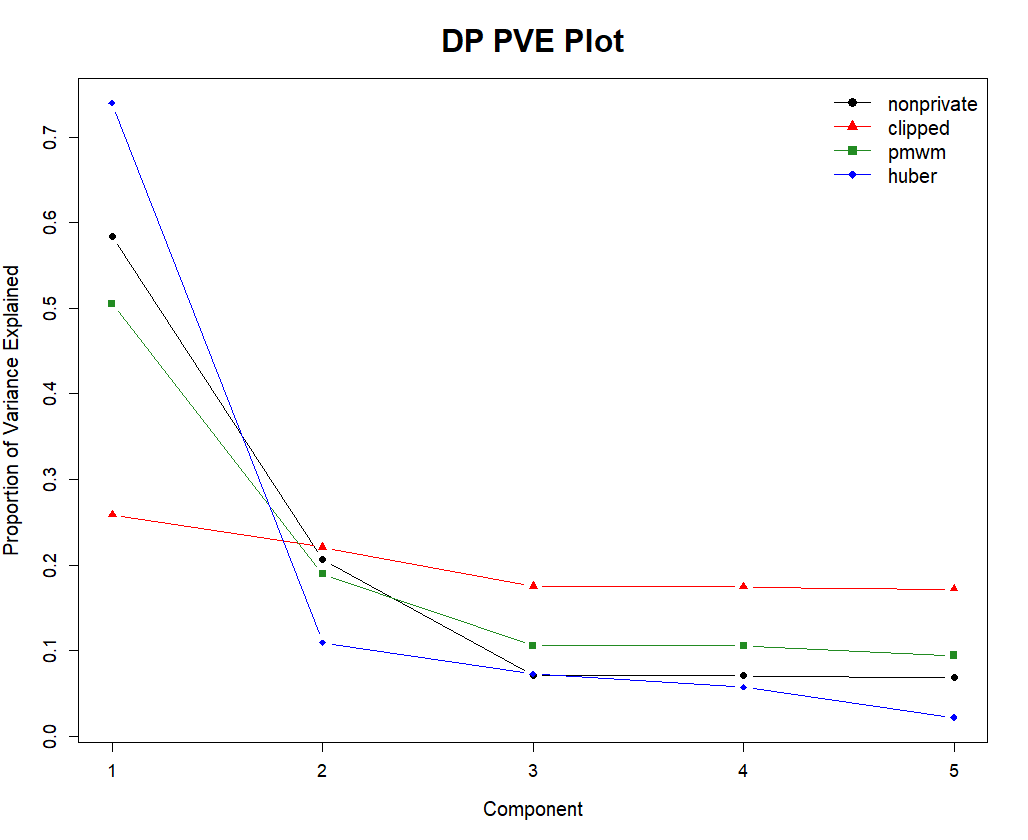
scree_alldp_scree_plot() visualizes private scree values or
private proportions of variance explained.
set.seed(123)

scree_plot_all <- dp_scree_plot(
  X,
  k = 5,
  method = c("clipped", "pmwm", "huber"),
  control = list(
    clipped = clipped_control(C_clip = 3),
    pmwm = pmwm_control(a = 0, b = 50, trim_const = 10, eta = 0.01),
    huber = huber_control(k_min_m2 = -10, k_max_m2 = 10, m2_frac = 1 / 4)
  ),
  eps = 3,
  delta = 1e-4
)
scree_plot_all
dp_score() computes differentially private summaries of
two-dimensional PCA scores using histogram-based methods.
set.seed(123)

score_result <- dp_score(
  X,
  eps = 3,
  delta = 1e-4,
  bins = c(8, 8),
  method = "add"
)

score_result
Available score methods include:
"add": additive histogram method;"sparse": sparse histogram method.Use method = "add" or method = "sparse" to
run one histogram method, or method = c("add", "sparse") to
compute both.
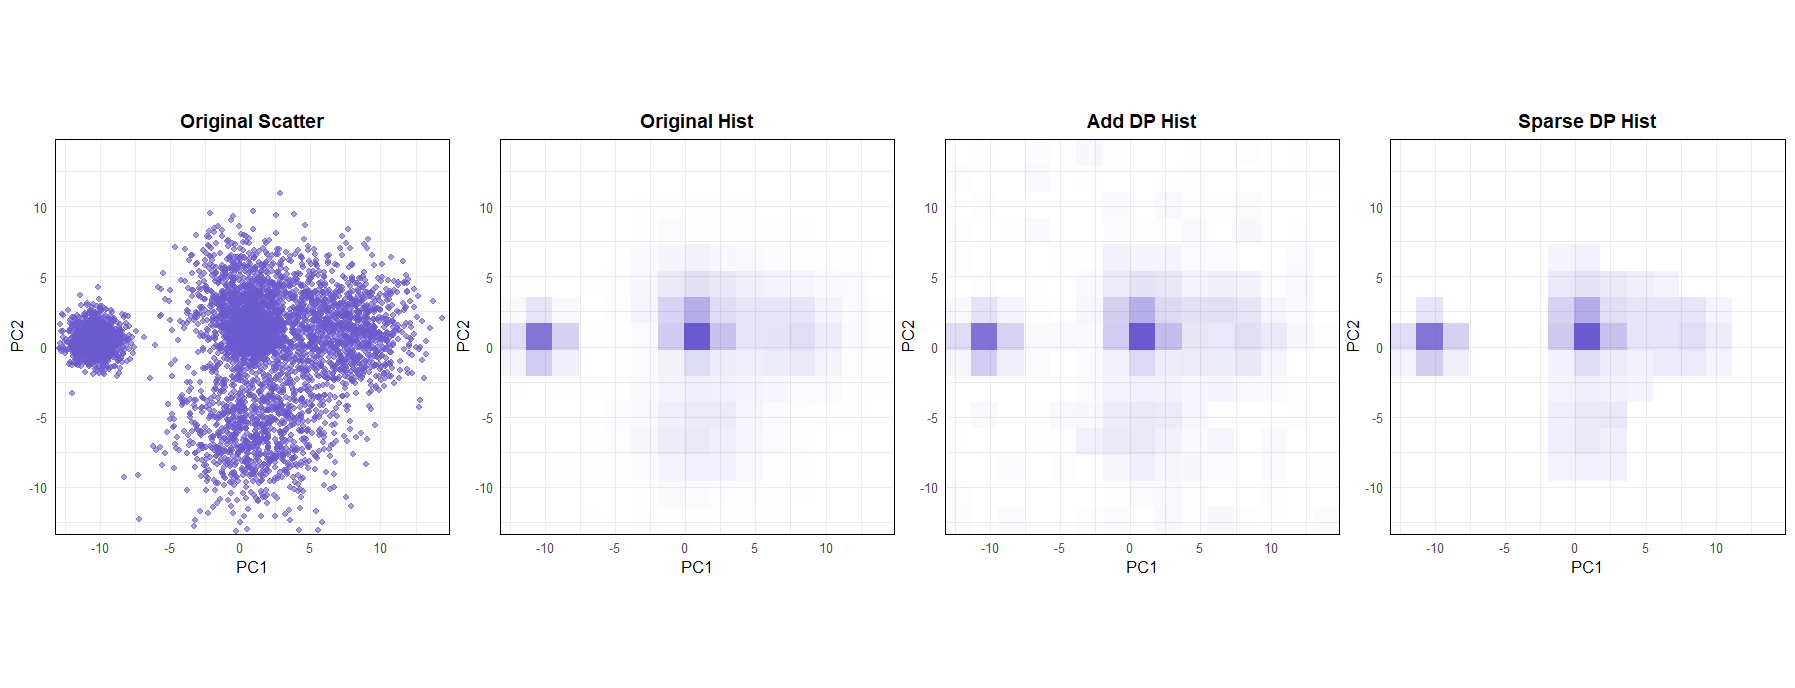
dp_score_plot() draws private score plots based on the
histogram summaries returned by dp_score().
If method is omitted, both additive and sparse histogram
methods are used.
set.seed(123)

score_plot <- dp_score_plot(
  X,
  eps = 3,
  delta = 1e-4,
  bins = c(15, 15)
)

score_plot$plot$all
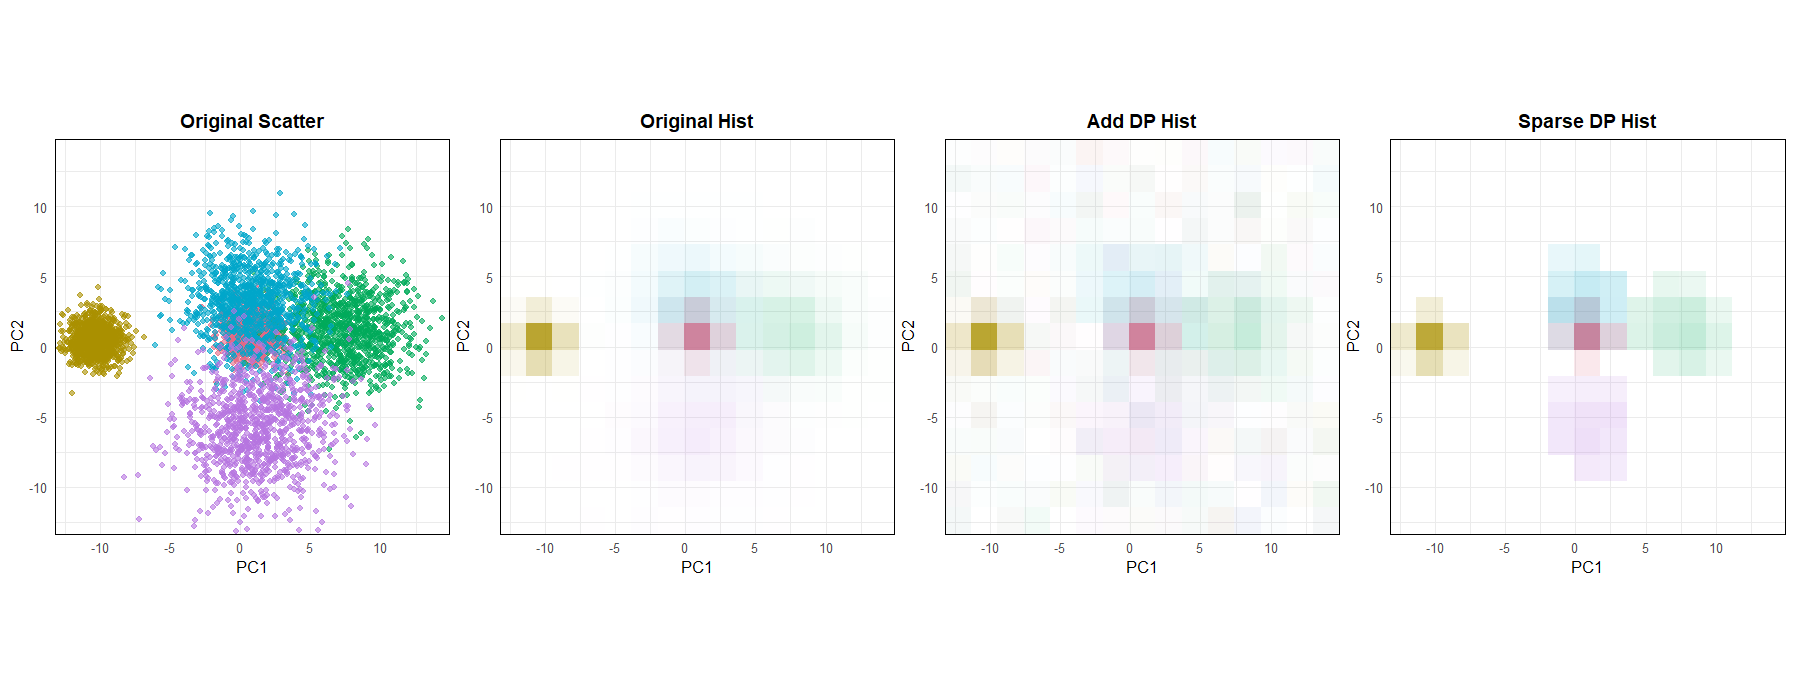
For data with group labels, dp_score_group() and
dp_score_plot_group() provide grouped versions of the
private score.
data(gau_g, package = "dppca")
X_g <- gau_g
Compute grouped private score.
set.seed(123)
score_group <- dp_score_group(
  X_g,
  group = "group",
  eps = 3,
  delta = 1e-4,
  bins = c(8, 8),
  method = "add"
)

score_group
Draw a grouped private score plot.
set.seed(123)

score_group_plot <- dp_score_plot_group(
  X_g,
  group = "group",
  eps = 3,
  delta = 1e-4,
  bins = c(15, 15),
)

score_group_plot$plot$all
dppca_app() launches a Shiny app for exploring private
scree and score plots through a graphical interface.
dppca_app()You can also launch the app with a user-supplied dataset.
data(gau_g, package = "dppca")
dppca_app(gau_g, group = "group")dppca includes three datasets for examples and
demonstrations:
gau: a synthetic 20-dimensional Gaussian cluster
dataset;gau_g: a grouped version of gau with an
additional group column;adult: a numerical subset of the Adult dataset from the
UCI Machine Learning Repository.The package includes a numerical subset of the Adult dataset from the
UCI Machine Learning Repository. The Adult dataset is licensed under the
Creative Commons Attribution 4.0 International (CC BY 4.0) license. This
package retains five numerical variables: age,
education_num, capital_gain,
capital_loss, and hours_per_week.
The package also includes synthetic Gaussian cluster datasets generated by the package authors for reproducible examples.
The methods and examples in dppca are related to the
following references.
Kim, M. and Jung, S. (2025). Robust and Differentially Private Principal Component Analysis. Statistical Analysis and Data Mining: An ASA Data Science Journal, 18(6), e70053. doi:10.1002/sam.70053.
Dwork, C. and Roth, A. (2014). The Algorithmic Foundations of Differential Privacy. Foundations and Trends in Theoretical Computer Science, 9(3–4), 211–407. doi:10.1561/0400000042.
Ramsay, K. and Spicker, D. (2025). Improved subsample-and-aggregate via the private modified winsorized mean. arXiv:2501.14095.
Yu, M., Ren, Z., and Zhou, W.-X. (2024). Gaussian differentially private robust mean estimation and inference. Bernoulli, 30(4), 3059–3088.
Nissim, K., Raskhodnikova, S., and Smith, A. (2007). Smooth Sensitivity and Sampling in Private Data Analysis. In STOC’07: Proceedings of the 39th Annual ACM Symposium on Theory of Computing, 75–84. doi:10.1145/1250790.1250803.
Wasserman, L. and Zhou, S. (2010). A Statistical Framework for Differential Privacy. Journal of the American Statistical Association, 105(489), 375–389. doi:10.1198/jasa.2009.tm08651.
Karwa, V. and Vadhan, S. P. (2017). Finite Sample Differentially Private Confidence Intervals. arXiv:1711.03908.
Becker, B. and Kohavi, R. (1996). Adult dataset. UCI Machine Learning Repository. doi:10.24432/C5XW20.